
Claude Dashboards shows the SQL behind every number
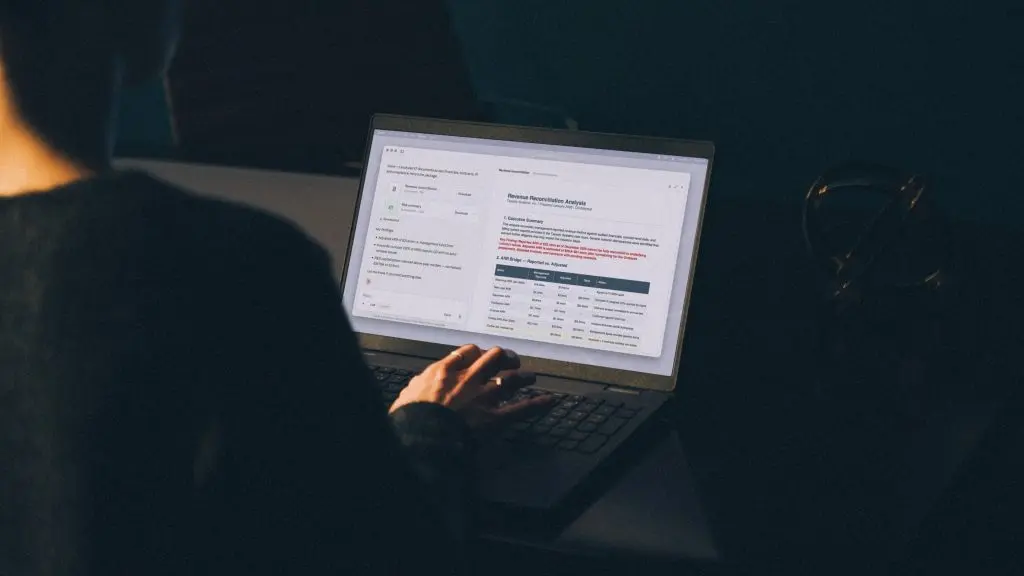
Every number on a Claude dashboard is clickable, and the click shows you the SQL query that produced it. That is the core of Claude Dashboards, a beta on paid plans that Anthropic announced on its blog together with an animation tool called Claude Motion and the end of the beta for Docs, Slides and Design.
At a glance
- Anthropic opened Claude Dashboards in beta on paid plans and Claude Motion in beta on Team and Enterprise, while Docs, Slides and Design left beta and now reach every plan, including Free.
- Dashboards connect to warehouses such as BigQuery, Databricks, Snowflake, Redshift and ClickHouse and refresh as data changes, while Motion writes animation code instead of calling a video model and exports MP4 files.
- The standalone claude.ai/design site closes on December 14, and the chats and comments there do not migrate. Public links to standalone projects stop working at the same time.
If you have not been following, Claude has handled live data before. According to HeadsUpAI, on Apr 20, 2026 Anthropic added Live Artifacts to Claude Cowork for Pro, Team and Enterprise. These are dashboards and trackers connected to apps and files that refresh whenever you open them. The New Stack also points out that OpenAI gave ChatGPT Work a data agent that builds dashboards about a month before this launch.
Every chart in Claude Dashboards shows its query and when it was last refreshed
Setup takes a couple of steps. You connect a data platform such as Amazon Redshift, BigQuery, ClickHouse, Databricks or Snowflake, then ask a question in plain language. Claude pulls the answer, builds the dashboard and keeps it current as the data changes. It also works with Claude's other connectors, so you can ask for a dashboard of your Salesforce opportunities.
Anthropic pitches it for quick, exploratory questions, like how this week's signups compare with last month's. Click any number to see the query behind it, or ask Claude to explain the figure. The New Stack dryly notes that the second option is for the rare users who would rather not read SQL. Each chart is stamped with the time its data was last refreshed.
When a question needs deeper analysis, you send the dashboard to Amplitude, Grafana, Hex, Mixpanel, Omni, Perplexity, PostHog or Sigma and pick up the work there. Anthropic lists Looker, monday.com and Tableau as coming soon. The company says Dashboards works alongside BI tools, and The New Stack agrees that its feature set cannot replace specialized BI software.
OpenAI's Data agent reached dashboards about a month earlier
The New Stack reports that OpenAI's Data agent launched as a ChatGPT Work plugin. It connects to Redshift, BigQuery, ClickHouse, Databricks, MongoDB, Snowflake and Datadog, and it can build dashboards directly in Power BI, Tableau, ThoughtSpot and other BI tools. The same outlet says it supports semantic layers such as Databricks Genie Ontology. A semantic layer is a shared set of business definitions, so that "revenue" means the same thing in every query.
The warehouse vendors have their own stake in this. The New Stack writes that Snowflake signed a $200 million deal with Anthropic in December 2025. Yet OpenAI's Data agent announcement included comments from product leaders at both Snowflake and Databricks, and both vendors have their own natural-language analytics tools. According to Snowflake, the two firms said at Snowflake Summit 26 on June 1, 2026 that Claude powers Snowflake Cortex Code and Snowflake Intelligence.
Claude Motion animates your material with code, with no generated footage
Motion is in beta on Team and Enterprise. Anthropic's examples are turning a quarterly report into a 30-second explainer for an all-hands, adding motion to a chart in a board deck, and building a product walkthrough for customer onboarding. The result plays like a short video. You adjust it in the editor or ask Claude for changes, then download it as an MP4.
Anthropic says Motion does not use a video generation model, so it produces no generated footage and no AI-generated people. To take an animation further, you can open it in Adobe, Descript, HeyGen, Higgsfield, invideo, Luma AI or Runway. Canva and Captions are listed as coming soon.
Both tools hand you the recipe: a query behind each chart, code behind each animation
Both products work the same way underneath. For a dashboard, Claude turns your question into a query against the warehouse, runs it and draws the result. The query stays attached to the number, so you can check what was counted and how. For Motion, Claude writes code that places and moves your text, charts, shapes and images, which means any word, number or timing can be changed by hand.
Think of a recipe card stapled to a cake. You can taste the result, and you can also see if someone used salt instead of sugar. A generated video gives you only the cake. Anthropic's own framing is that Claude makes the first version and you decide what gets shared.
Docs, Slides and Design leave beta after more than 45 million files
Anthropic says people have made more than 45 million docs, decks and designs in Claude since these tools arrived in every conversation, and that most changes since then came from user feedback. With the beta label gone, Artifacts now support CMEK, and admins choose which artifact templates their organization uses.
Your team and Claude can edit the same doc, deck, design or dashboard together. If your admin allows it, slides, designs, dashboards and animations can be shared outside the organization or with anyone who has the link. PowerPoint and PDF exports match the editor, decks go to Google Slides as editable files, and you can edit docs, decks and designs in the Claude mobile app.
Claude Design started at claude.ai/design, and since September 16 it has also worked inside every Claude conversation. Anthropic says running two versions slows down fixes for both, so the standalone site is closing. The "Migrate team design systems" button on the Artifacts page moves every design system in the organization in one go. Projects keep working in the standalone version until it closes.
Anthropic does not say how often dashboards refresh, or how warehouse permissions apply to people viewing a shared dashboard. It also mentions no semantic-layer support, which The New Stack credits to OpenAI's Data agent, so business definitions likely live inside each individual query. In our view, showing the SQL is the right design choice, but it only protects readers who can read SQL, and asking Claude to explain a figure means Claude checking its own work.
October 15, then December 14
For Enterprise admins, Dashboards and Motion are off by default and can be turned on under Organization settings > Artifacts. Docs, Slides and Design switch on by default on October 15. The standalone Design site closes on December 14 and takes its chats, comments and public links with it, so copy out anything worth keeping. No dates have been given for Looker, monday.com, Tableau, Canva or Captions.
Related stories
- Anthropic folds Cowork into Claude chat and adds Slides
- Claude now works inside Google Docs, Sheets and Slides
- Anthropic trains AI engineers like medical residents
- Cowork drops local-only mode for Pro and Max on October 6
- Anthropic's Playground shows the cost of each API call
- Four of five Claude cells retain prompts by default
Comments
No comments yet. Be the first.
Join the conversation
Sign in with Google to leave a comment. Your name and avatar come from your Google profile, and the comment appears after moderation.