
Claude agents get an OpenTelemetry trail for every step
"Agents that touch a company's books have to show their work, the same way an accountant does," one customer says in Anthropic's announcement. Claude Managed Agents, the Messages API and Claude SDKs can now send OpenTelemetry traces to any OTel tool, in public beta, so you can follow each step an agent takes.
At a glance
- Every agent turn, model call and tool use can now leave Claude as a standard OpenTelemetry trace, carrying latency, token counts and IDs, and land in whichever observability tool you already run.
- Managed Agents and the Messages API need a destination set in the Claude Console, while SDKs export automatically; traces follow the OpenTelemetry GenAI semantic conventions so other providers' data fits alongside.
- The feature is in public beta and the announcement does not mention pricing, retention or sampling, so the numbers come from customers: Ramp says its Reflect system cut token usage by 10–20% on some agents.
If you have not been following: Claude Managed Agents, Anthropic's hosted way to run agents, went into public beta on April 8, 2026. According to Anthropic's Claude product page, session tracing, integration analytics and troubleshooting guidance were built into the Claude Console from launch, so you could inspect every tool call, decision and failure mode there. The new release sends that kind of data out to tools you run yourself.
Every turn, model call and tool use becomes a trace with latency, tokens and IDs
How you set it up depends on the product. For Managed Agents and the Messages API, you add a destination in the Claude Console. The Claude SDKs export traces automatically. Once tracing is on, each agent turn, model call and tool use arrives in your observability tool as a standard OpenTelemetry trace, with latency, tokens and IDs attached.
Testing Catalog, in its post on the release, lists the default fields as duration, status, token counts, model and tool names. Anthropic describes the feature as a way to build trust step by step: trace the agent's model calls, tool use and MCP server calls, review the traces, then widen its access as it proves reliable.
If your team already sends Claude Code or Cowork traces to an observability tool, the agents you build on the Claude Platform can show up in the same place. The partner list is not a whitelist either. Any OpenTelemetry tool that accepts a standard OTLP endpoint will take Claude traces.
Anthropic names 12 tools, sorted into three jobs
The first job is debugging. In Grafana Cloud, Honeycomb, Sentry and Splunk, agent traces sit beside your logs and metrics, so when a step is slow or fails you can see which service it came from, the same way you would trace a slow API request.
The second job is making agents better. Anthropic lists Arize AI, Braintrust, Datadog, Langfuse, LangSmith by LangChain, New Relic and PostHog as places where you can turn real production traces into evals, catch quality issues and measure whether a change actually helped.
The third job is governance. Traces sent to Databricks Unity Gateway let platform and security teams see token usage broken down by team and flag unusual activity across the organization.
Ramp says trace-driven fixes made some agent sessions 30% faster
Ramp built Reflect, an agentic system that scores its Langfuse traces, finds recurring failures and proposes fixes. On some agents, Ramp says, Reflect has already cut token usage by 10–20% and made sessions 30% faster. Ramp's own caveat: Reflect can only improve what it observes, and native export feeds instrumentation into that loop with no extra steps.
Foxglove, which builds agents that help robotics teams debug their robots, analyzes agent interactions in PostHog next to product usage data to see where its agents fall short. Sterling Labs, whose agents analyze live markets 24/7, calls Langfuse its "pit wall" and says traces now stream in with no custom instrumentation.
The accountant line comes from a customer whose agents run on the Claude Platform and whose telemetry lives in Grafana Cloud. Each model call sits in the same trace as the reconciliation or journal-entry workflow it ran inside, with prompt version, tool calls, latency and token spend visible.
"When an auditor asks what an agent did and why, we can answer from one timeline."
What does a trace actually record?
A trace records one piece of work as a tree of timed steps: the agent turn at the top, the model calls and tool calls nested inside it. Think of a parcel tracking page that logs every depot a package passed through, with a timestamp for each. OpenTelemetry is the open standard for formatting and shipping those records, and OTLP is its transport protocol.
The GenAI semantic conventions are shared field names for things like the model used and the tokens consumed. Because Claude traces follow them, Anthropic says, data from Claude and from other providers works in the same tools and dashboards.
In Anthropic's engineering write-up, Managed Agents splits an agent into a session (an append-only log of everything that happened), a harness (the loop that calls Claude and routes tool calls) and a sandbox where code runs. The early design put all three in one container, and the only window in was a WebSocket event stream that could not tell a harness bug from a dropped packet or a container going offline.
The announcement leaves plenty unsaid: whether traces can carry full prompt and response text beyond the default fields, how long data is buffered, and whether export costs anything. Ramp's 10–20% and 30% figures cover some agents only, with no stated baseline. In our view, following the GenAI conventions instead of a proprietary format is the most useful choice here, because Claude's traces can then be read in whatever tool a team already uses.
When the beta label comes off
OpenTelemetry traces on the Claude Platform are in public beta, and Anthropic has not given a date for general availability or said what might change before then. Managed Agents itself has been in public beta since April 8, 2026. For teams building dashboards and evals on these traces now, the open question is whether field names and defaults stay the same through the beta. The announcement does not answer it.
Up next
Claude Code desktop now shows which sessions need you, Video
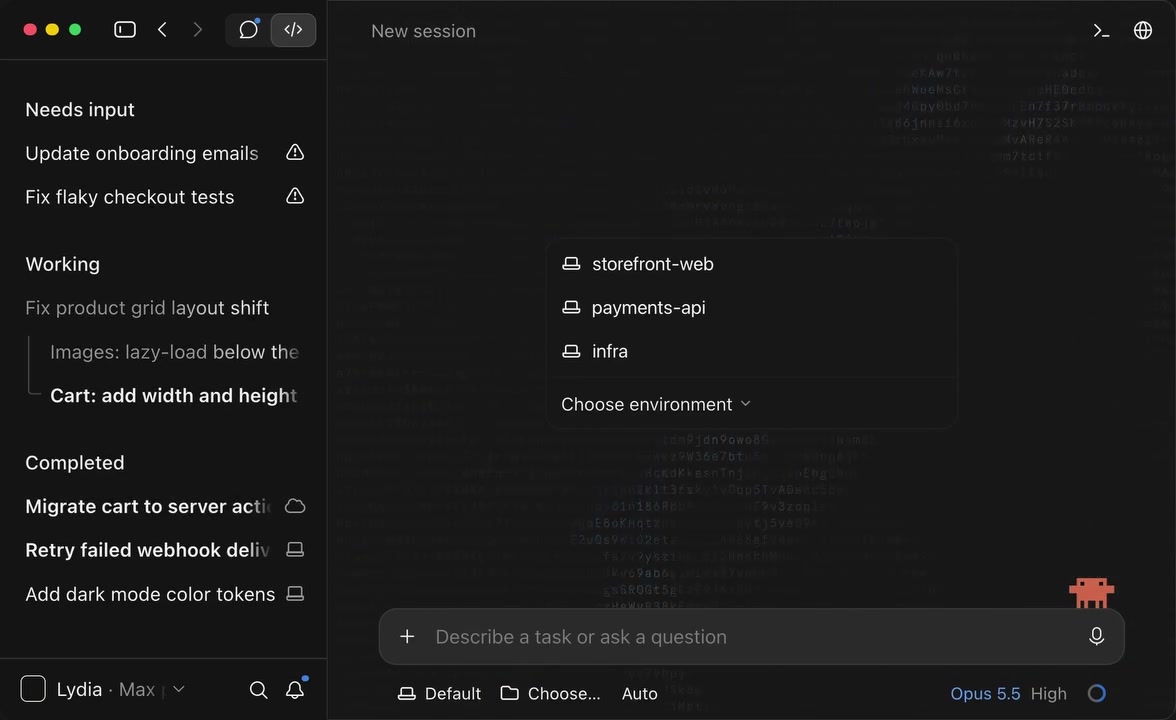
You've got three Claude Code sessions running and one of them is quietly stuck waiting on you. The desktop app's new sidebar flags which sessions are working and which need you. Do you run several Claude Code sessions at once, or stick to one thread at a time?
Related stories
- Claude Directory opens a submission flow for plugins
- Four Opus 5.5 API changes make Opus 5 requests fail
- Commerce agent blueprint ships with every write staged
- Editing chat history now breaks Claude's thinking blocks
- Research preview opens for agent-to-machine control
- Anthropic test agents reached a State Department visa form
Comments
No comments yet. Be the first.
Join the conversation
Sign in to leave a comment. It appears after moderation.