
Claude API sends its traces to your observability tool
Every model request and every tool use your Claude app runs can now show up as a span in your own observability tool, and you don't have to change a line of code. According to Anthropic's documentation, OpenTelemetry export for the Messages API and Claude Managed Agents is in public beta, and you set it up by adding a destination in the Claude Console.
At a glance
- An admin adds a destination in the Claude Console that points the API at an OTLP/HTTP endpoint, and Messages API requests and Managed Agents sessions start emitting spans to it.
- Metadata only mode sends duration, status, token counts, model and tool names, while Full content adds prompts, responses, tool inputs and tool results, and a W3C traceparent header nests spans under yours.
- Delivery is at least once and best effort, so expect duplicates and spans lost for good, and a destination whose deliveries all fail for 24 hours is disabled automatically.
If you haven't followed Managed Agents: according to Claude Lab, it went into public beta on April 8, 2026. In its engineering write-up, Anthropic describes an early design that put the session, the harness and the sandbox in a single container. The only window inside was the WebSocket event stream, which couldn't tell a harness bug from a dropped packet or a container going offline.
Adding a destination takes the admin role and an HTTPS endpoint on port 443
You need the admin role in the Console organization to add or change destinations, while the developer role can only view them. The endpoint must accept OTLP/HTTP with protobuf encoding at an HTTPS URL on port 443. A self-hosted OpenTelemetry Collector listens on port 4318 by default, so reconfigure it for HTTPS on 443 or put a load balancer or reverse proxy in front.
In the form, you pick a listed provider or Custom. Then you enter a base endpoint URL of up to 2,048 characters, using a hostname rather than an IP address and leaving off /v1/traces, which the API adds. Credentials go in request headers: up to 20 per destination, names up to 128 bytes, values up to 4,096 bytes, and 16,384 bytes combined. After you save, the Console never shows the header values again.
The Admin API and CLI take the same settings except Provider, and there you set traces.max_content_bytes yourself. The Test action sends an anthropic.test span. Once real traffic flows, the Delivery column should show Healthy within about a minute, and in your tool you filter on service.name = claude-platform. Spans from the Claude SDKs are set up through a separate guide.
Spans follow the OpenTelemetry gen_ai conventions and come in two content modes
According to the ClaudeDevs announcement, spans follow the gen_ai conventions and by default carry metadata such as duration, status, token counts, model and tool names. Switch a destination to Full content and it also exports prompts, responses, tool inputs and tool results, with an optional per-span size cap that the Console fills in for your provider. If spans have no prompts or responses even in Full content mode, the documentation says your organization might have a HIPAA, FERPA or K-12 data-handling restriction with Anthropic.
Each destination covers All workspaces (including the Default Workspace and ones created later), Selected workspaces, or All except a list, and you can select up to 1,000 workspaces. The API sends spans to every enabled destination that covers the workspace where a request or session runs. Once delivered, the data sits with your chosen service, outside Anthropic, under that service's retention and access controls.
A W3C traceparent header puts Claude's spans inside your own traces
By default, the API spans for a request or session form their own trace. If you send a W3C traceparent header, they nest under your application's spans, and if its sampled flag is off, the API emits nothing for that request. Claude Platform on AWS doesn't support the header yet, so spans for requests sent there always start their own traces, even with the sampled flag off.
The MCP connector passes the trace on to your MCP server, and every request and notification it sends carries a traceparent in params._meta. In a tools/call request it points to the anthropic.mcp_tool_use span, and in other messages it points to anthropic.messages.create. Requests the API doesn't trace get no traceparent.
An organization gets 10 destinations, and a delivery gets 10 seconds
Think of a courier who sometimes rings twice but never comes back for a parcel that fell off the truck. That is at-least-once, best-effort delivery. A span can arrive twice, so you remove duplicates using the trace ID and span ID, and a lost span can't be sent again.
The first request of each delivery is gzipped, and if your endpoint answers 400 or 415, the API resends the same spans uncompressed right away. Timeouts, connection, TLS and DNS failures, and 408, 429 and 5xx responses get retried later, a limited number of times. Your endpoint has 5 seconds for the TLS handshake and 5 for the response headers. The whole delivery, including the resend, times out after 10 seconds, and every request carries User-Agent: Claude-Platform.
An organization can have 10 destinations, disabled ones included. The API disables a destination when the endpoint sends a 3xx redirect, when its hostname resolves to an IP address that isn't public, or when all deliveries fail for 24 hours. Once you fix the cause, Enable restarts export within about a minute.
The documentation doesn't say how many retries "a limited number of times" means, and it admits that lost spans can't be recovered. In our view, that makes the 24-hour auto-disable the rule to watch most closely. A collector that stays down for a day will likely leave both a gap in your traces and a destination that someone has to turn back on by hand.
When OpenTelemetry export leaves beta
The feature is in beta on both the Claude API and Claude Platform on AWS, and Anthropic hasn't given a date for a stable release. The documentation also gives no date for traceparent support on AWS. Until it arrives, spans for requests sent there start their own traces, even when the sampled flag is off.
Up next
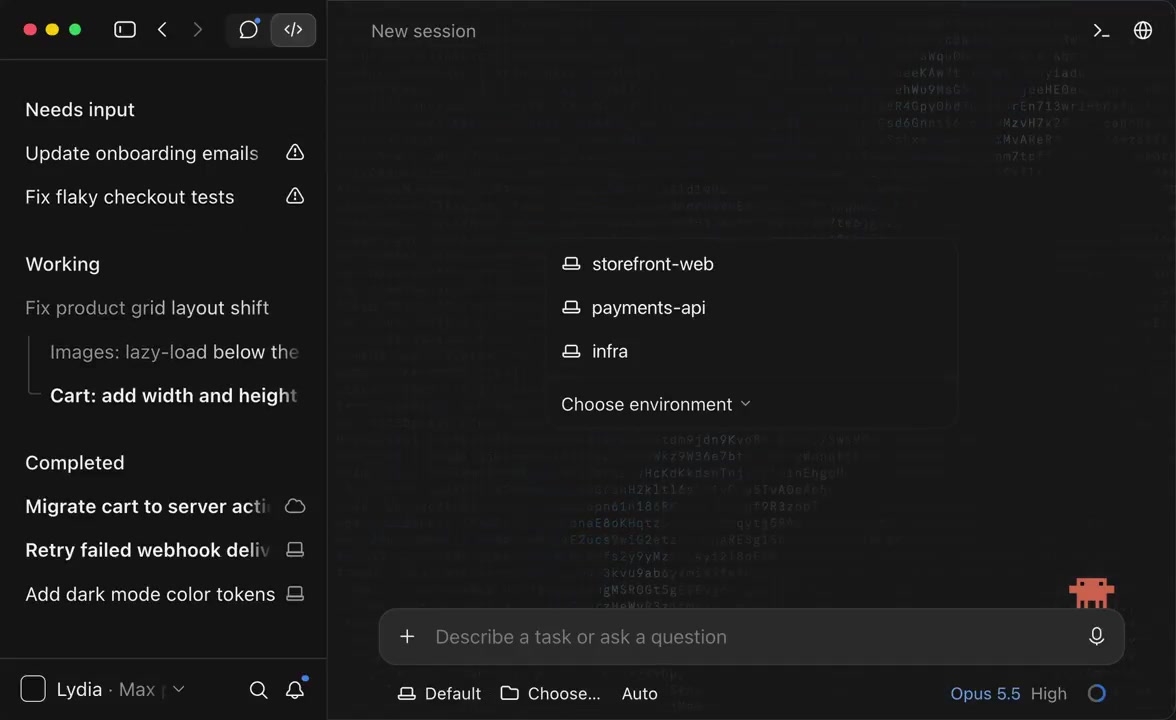
Claude Code desktop gives each parallel task its own session, Video
One prompt, several parallel tasks, and Claude Code's desktop app hands each one its own nested session, which reports back when done so your main thread stays readable. Has a side task ever buried your main Claude Code thread?
Related stories
- Claude Managed Agents now plans runs of up to 1,000 agents
- Claude plugins get a portal as MCP usage climbs 110x
- Claude Code 2.1.300 splits cache writes by lifetime in OTel
- Claude Code 2.1.299 compacts idle chats before cache expiry
- Subagents in Claude Code 2.1.296 can compact early
- Anthropic's daily-brief agent treats a failed read as news
Comments
No comments yet. Be the first.
Join the conversation
Sign in to leave a comment. It appears after moderation.